
Mundane Astrology Explained for Investors
Quick Answer
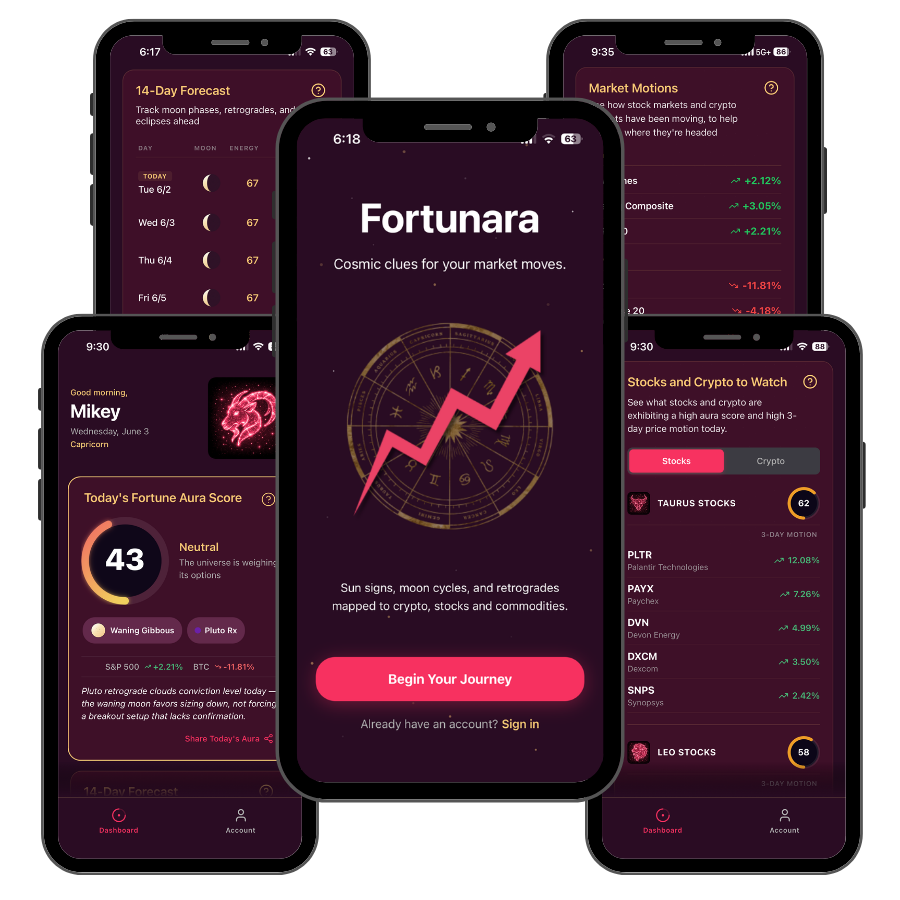
Get cosmic clues for your market moves.
Daily planetary signals mapped to your watchlist. Personalized to your sign.
Get Early AccessFor entertainment only. Not financial advice.
The Oldest Branch of the Discipline
Most people’s exposure to astrology starts and ends with personal birth charts — the natal chart cast for an individual based on their birth date, time, and location.
Mundane astrology inverts that orientation entirely. It asks: what does the planetary configuration at the founding of this institution, nation, or market tell us about its nature? And what do current planetary transits to that founding chart tell us about what that entity is likely to experience?
This approach predates personal astrology by centuries. The Babylonians used mundane astrology to predict the fate of kingdoms based on planetary configurations at coronations and solstices. Medieval court astrologers cast charts for the founding of cities and the coronation of monarchs. The application to financial markets is a modern extension of a very old methodology.
Exchange Charts and Market Analysis
Every major stock exchange has a founding date, and that date gives it an astrological chart — a snapshot of planetary positions at the moment the exchange came into existence.
The New York Stock Exchange was incorporated on May 17, 1792, under a buttonwood tree on Wall Street. Financial astrologers have studied the NYSE natal chart for over a century. W.D. Gann’s market analysis was explicitly anchored to this chart. Bill Meridian continues to use it as a primary reference for US equity market timing.
The practical use: when significant planetary transits occur to sensitive degrees of the NYSE chart, practitioners watch for corresponding market events. When Pluto was conjunct the NYSE’s natal Saturn in 2020, practitioners flagged it as a high-risk structural stress window — it coincided with the fastest bear market in recorded history.
Similar exchange charts exist for the London Stock Exchange, the Bombay Stock Exchange, and most major global markets. International portfolio managers who use mundane astrology track transits to multiple exchange charts as part of their macro rotation framework.
National Charts and Macro Investing
Countries have founding charts, typically cast for the moment a nation’s constitution was signed, independence was declared, or a current governmental structure was established.
The United States’ Sibly chart — cast for 4 July 1776, with a Sagittarius rising — is the most studied national chart in financial astrology. Transits to this chart are used by practitioners to time periods of national economic stress, expansion, or structural transformation.
The Pluto return — Pluto returning to its natal position in the US chart — occurred in 2022 for the first time in American history (Pluto’s 248-year orbit means it had never completed a full cycle since 1776). Practitioners identified this as a period of structural reckoning for American institutions. The 2022 market correction, the institutional credibility challenges of that period, and the structural debates about American governance all fit the Pluto return framework.
For international investors, understanding the national charts of the countries in their portfolio and the current planetary transits to those charts provides a macro timing layer that conventional country analysis doesn’t offer.
Company Charts: The First-Trade Methodology
The most directly actionable application of mundane astrology to individual equity investing is the first-trade chart methodology developed most systematically by Bill Meridian.
Every publicly traded company has a first trading date — the day its shares first changed hands on a public exchange. That date gives the company an astrological chart. Transits from current planetary positions back to that natal chart are used to identify windows of potential strength or vulnerability for the company.
Meridian’s research, which spans decades and hundreds of companies, identifies consistent patterns: Saturn transiting over a company’s natal Sun tends to coincide with periods of structural difficulty or fundamental testing. Jupiter transiting the natal Jupiter tends to coincide with expansion phases. Pluto transiting sensitive natal degrees tends to coincide with transformation — sometimes through merger or acquisition, sometimes through fundamental business model disruption.
The methodology doesn’t tell you what will happen to a company. It tells you when a company is under astrological stress or support, which practitioners layer onto fundamental and technical analysis as an additional timing dimension.
Meridian’s work on first-trade charts is cited in Robert Colby’s Encyclopedia of Technical Indicators — a mainstream financial reference text — specifically for his identification of the 3.8-year market cycle, which Meridian derived through planetary cycle analysis applied to market chart data.
Ingress Charts and Seasonal Timing
A third mundane technique is the ingress chart — a chart cast for the moment the Sun enters a cardinal sign (Aries, Cancer, Libra, or Capricorn). These four ingress charts, corresponding to the solstices and equinoxes, are read as quarterly market forecasts by practitioners.
The tradition holds that the chart cast for the Sun’s entry into Aries — the vernal equinox — describes the market themes for the entire year ahead. The Cancer ingress (summer solstice), Libra ingress (fall equinox), and Capricorn ingress (winter solstice) modify and update the annual forecast on a quarterly basis.
Ray Merriman’s MMA Cycles research uses ingress charts extensively as part of his annual market forecasting methodology. His documented track record across decades includes successful calls on major market turning points using ingress chart analysis combined with geocosmic (planetary) cycle work.
The Relationship to Modern Quantitative Analysis
The comparison that practitioners most often make between mundane astrology and modern financial analysis is to quantitative factor investing. Quantitative analysts identify recurring patterns in market data and use those patterns as systematic signals. Mundane astrologers identify recurring planetary configurations and correlate them with market patterns.
The methodology is different. The logical structure is similar: past pattern, systematic identification, forward application. The debate is about whether the planetary patterns have predictive validity — and that debate is ongoing, with practitioners producing documented track records and academics producing mixed results in peer-reviewed research.
What’s not debatable is that the methodology has been applied seriously, by credentialed professionals, with documented results, for decades. Whether that’s sufficient evidence is a decision each investor makes individually.
Common Questions
Is mundane astrology more or less reliable than personal astrology for market purposes?
Do I need to cast and read charts myself to use mundane astrology?
Where does the NYSE natal chart come from?
Fortunara is for entertainment only. Nothing on this page constitutes financial advice.
The mundane astrology signals that practitioners track manually inform the macro backdrop of Fortunara's Cosmic Forecast.
Synthesized into a daily read without requiring chart calculation expertise.
For entertainment only. Not financial advice.