
How Moon Phases Affect Stock Markets
Quick Answer
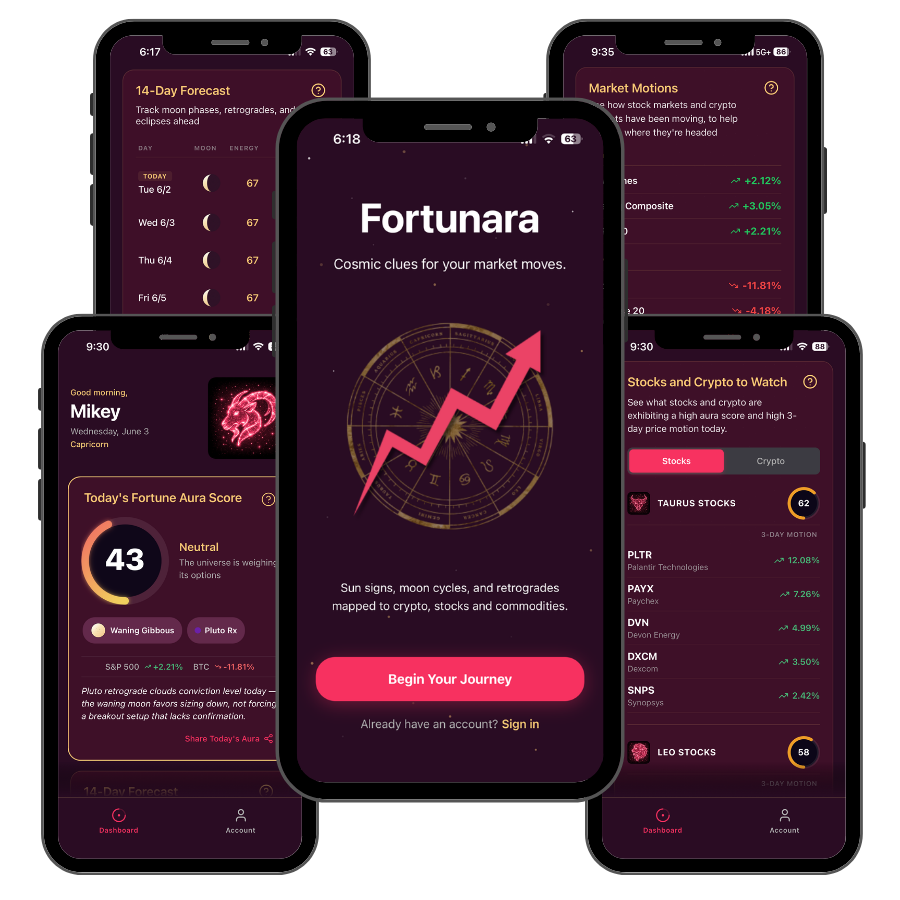
Get cosmic clues for your market moves.
Daily planetary signals mapped to your watchlist. Personalized to your sign.
Get Early AccessFor entertainment only. Not financial advice.
The Study That Changed the Conversation
In 2003, Ilia Dichev and Troy Janes published “Lunar Cycle Effects in Stock Returns” in the Journal of Finance. It’s worth dwelling on that publication venue for a moment. The Journal of Finance is not a fringe publication. It is one of the most selective, heavily peer-reviewed journals in academic economics. Getting a paper on lunar cycles published there required methodology rigorous enough to withstand the scrutiny of editors and reviewers who would have been, at best, skeptical.
The paper survived that scrutiny. And its findings are significant.
Across 25 countries, covering several decades of stock market data, Dichev and Janes found consistent evidence that stock returns were higher in the 15 days around new moons than in the 15 days around full moons. The annualized return differential was approximately 8.3 percentage points. The effect held after controlling for known calendar anomalies — the day-of-week effect, the January effect, and other well-documented seasonal patterns that could otherwise explain the result.
For context: 8.3 percentage points of annualized return differential is comparable in magnitude to the weekend effect, which is one of the most-studied anomalies in financial economics. This is not a trivial number.
What the Researchers Said Caused It
Dichev and Janes were careful not to claim any metaphysical mechanism. They proposed a behavioral channel: lunar cycles affect human physiology and mood in ways that have been documented in the clinical literature. When those individual-level effects aggregate across millions of investors making decisions simultaneously, the signal becomes visible at the market level.
This is the same logic that underlies behavioral finance broadly. Markets are moved by human beings, and human beings are affected by their environment. If the lunar cycle systematically affects mood, sleep quality, and risk appetite across large populations, then collective investor behavior should show a lunar signature. The Dichev and Janes data suggests it does.
The researchers were explicit that they were not claiming the moon causes anything directly. They were documenting a statistical pattern and proposing the most plausible behavioral explanation. That distinction matters. The financial case for tracking lunar phases doesn’t depend on any particular theory of lunar causation. It depends only on whether the pattern is real — and the evidence suggests it is.
How to Read the Data Honestly
The Dichev and Janes finding is statistical in nature. It describes average behavior across many lunar cycles, not the behavior of any individual cycle.
There are new moon periods with negative market returns. There are full moon periods with strong positive returns. The pattern lives in the aggregate — if you were to overlay every new moon and full moon period across 25 countries over 30 years, the average new moon period outperforms the average full moon period by roughly 8 percentage points annualized. Individual instances deviate from this average constantly.
This is how any probabilistic signal works. The fact that a coin flip shows heads 52% of the time doesn’t mean the next flip will be heads. It means that over a large enough sample, the 52% distribution is real and persistent. Lunar phase signals in financial astrology should be understood in exactly the same terms.
Serious practitioners don’t use lunar phase awareness as a rule that overrides all other analysis. They use it as a contextual layer that shifts probability estimates at the margin. When other signals support initiating a position and the lunar phase is favorable, the confluence is meaningful. When lunar phase signals conflict with other indicators, the conflict is worth noting.
The New Moon and Full Moon Distinction
Financial astrology maps the Dichev and Janes statistical finding onto a traditional framework that practitioners have used for centuries.
New moons represent beginnings. The lunar cycle starts at the new moon, when the moon is invisible and its light is building. Traditional practice associates new moon periods with initiation, fresh starts, and the planting of seeds. In market terms: favorable conditions for opening new positions, beginning new investment research processes, and deploying capital that has been on the sidelines. New moon investing guide →
Full moons represent culmination. The lunar cycle peaks at the full moon, when the moon is fully illuminated. Traditional practice associates full moon periods with completion, revelation, and the surfacing of what was previously hidden. In market terms: a natural period for reviewing existing positions, assessing what’s working and what isn’t, and being cautious about new initiations. Full moon market guide →
The Dichev and Janes data gives empirical support to this traditional framework. The two don’t align by coincidence — the behavioral mechanism (mood and risk appetite) explains why the traditional associations developed in the first place. People across cultures have observed this pattern for millennia.
The Crypto Amplification
The lunar cycle effect appears to be stronger in crypto markets than in traditional equity markets. Two factors explain this.
First, retail sentiment dominates crypto markets more completely than it does equity markets. Institutional investors, with their quantitative models and risk management frameworks, dampen sentiment-driven behavior in equity markets. In crypto, the retail sentiment layer is thicker and more influential. If lunar cycles affect collective mood and risk appetite, their effect on crypto prices should be larger — and practitioner observation suggests it is.
Second, the demographic overlap between astrology-following communities and crypto-native communities is significant. The investors most likely to be actively modifying their behavior around lunar phases are disproportionately represented in crypto markets. This creates a partial self-fulfilling effect that amplifies the statistical signal.
For crypto investors who use financial astrology, the lunar phase framework is one of the most actively applied tools in the discipline. See the crypto-specific guide →
Running Your Own Test
The Dichev and Janes study is publicly available, and any investor can run a basic version of their test independently. Lunar phase dates going back decades are freely available from multiple sources. Major index return data is similarly accessible. Overlaying the two and computing average returns by lunar phase requires basic spreadsheet work.
The exercise is instructive regardless of the result. If you find the pattern in your own data, it reinforces the empirical case. If you find it weaker in recent years, that’s also useful information — some researchers have noted that the effect may have weakened since publication, possibly because publication increased awareness of the anomaly. Either way, you’ve built your own evidence base rather than relying on a 20-year-old study.
This is the discipline of financial astrology at its most empirical: not acceptance of doctrine, but systematic pattern testing.
Common Questions
Has the Dichev and Janes study been replicated?
Is 8.3 percentage points enough to trade on?
How do I find current lunar phase dates?
Fortunara is for entertainment only. Nothing on this page constitutes financial advice.
Fortunara's Cosmic Forecast tracks the full lunar cycle — current phase, days to next new or full moon, and how the phase interacts with your sign's daily Fortune Aura.
No separate lunar calendar required.
For entertainment only. Not financial advice.